Events
Include expired: true
and Keywords: Statistics or Data visualisation or data management plan
and City: Bogota or Carlton or Copenhagen or Liverpool or Tallinn or Uppsala or Washington
Subscribe to Filter
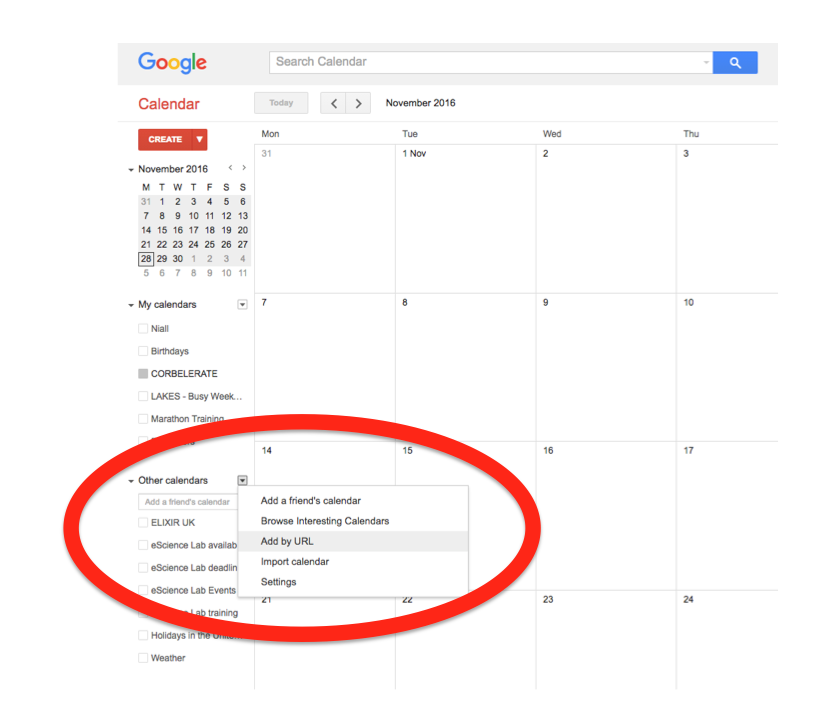
Importing into Google Calendar
In the left-hand column of the Google Calendar main view, click the arrow to the right of "Other calendars" and click "Add by URL". In the form that appears, paste in the URL from the box above, and click the button to confirm.
Please note, it may take a while for newly created events in TeSS to synchronise with your Google Calendar.
-
Workshops and courses
R for data science

31 March - 3 April 2020
Liverpool, United Kingdom
Face-to-face
Bioinformatics Statistics and probability R Programming Statistical-model Statistics Pre-processing Transcriptomics Metabolomics Proteomics -
Workshops and courses
R for beginners
1 - 3 April 2020
Liverpool, United Kingdom
Face-to-face
Statistics and probability Computational biology R-programming biostatistics Statistics R programming life sciences, bioinformatics Clinical Bioinformatics -
Workshops and courses
Introduction to Data Management Practices
5 - 7 April 2022
Uppsala
Face-to-face
Data submission, annotation, and curation FAIR data Data management Filtering Format validation Formatting Deposition Data handling data management data publication storage DMP data organisation metadata data quality data management plan -
Workshops and courses
Andmete visualiseerimine (teooria)
18 April 2024 @ 14:00 - 16:00
Tallinn, Estonia
Face-to-face
Data visualisation Data Visualization Data visualization data visualization data visualisation -
Workshops and courses
Visualisatsioonide tegemine RStudio-ga
19 April 2024 @ 09:00 - 13:00
Tallinn, Estonia
Face-to-face
Data visualisation Data Visualization Data visualization data visualization data visualisation RStudio R ggplot2

Note, this map only displays events that have geolocation information in
TeSS.
For the complete list of events in TeSS, click the grid tab.